
Your performance, no blind spots
The Performance page takes your PnL apart across 5 tabs: Overview, Drivers, Quality, Records and Trades. You see where your money comes from, when, with which setups, and where you leave some behind.
An edge is proven, not guessed
A good feeling is not enough. The Performance page puts numbers on your trading: where your PnL comes from, when, with which setups, so you repeat what wins instead of what reassures you.
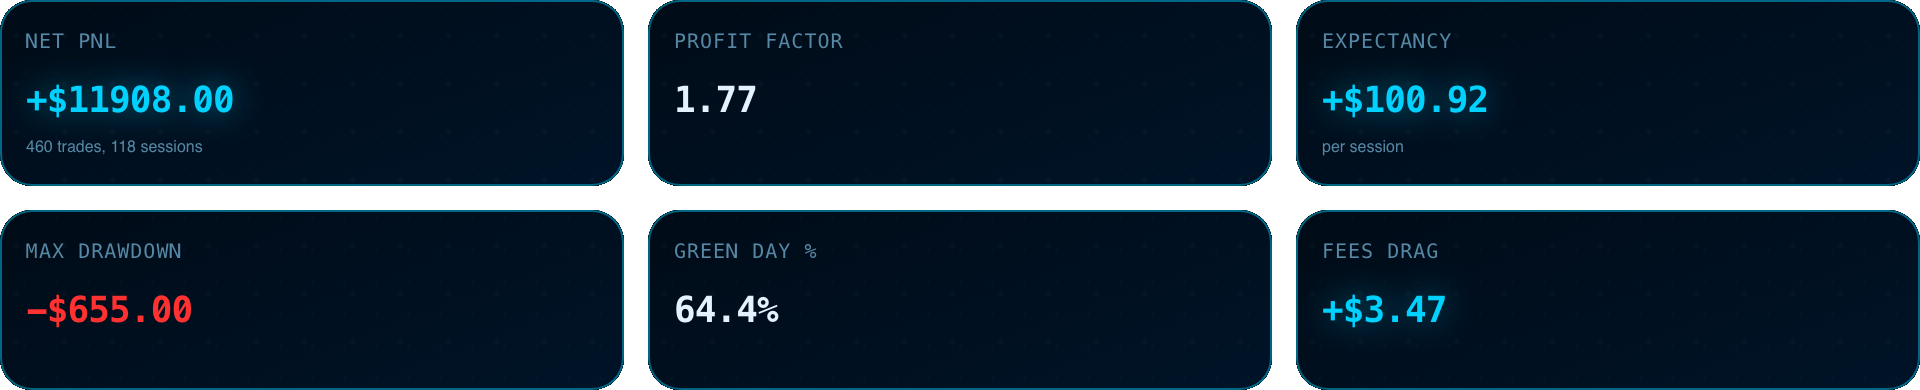
Your 6 key metrics, right at the top
Net PnL, profit factor, expectancy per session, max drawdown, share of green days and the cost of fees. The pulse of your account, always visible at the top of the page. Change the period or filter on a strategy and all six update instantly.
- Net PnL, profit factor, expectancy
- Max drawdown, green days, cost of fees
- Instant update for the period you pick
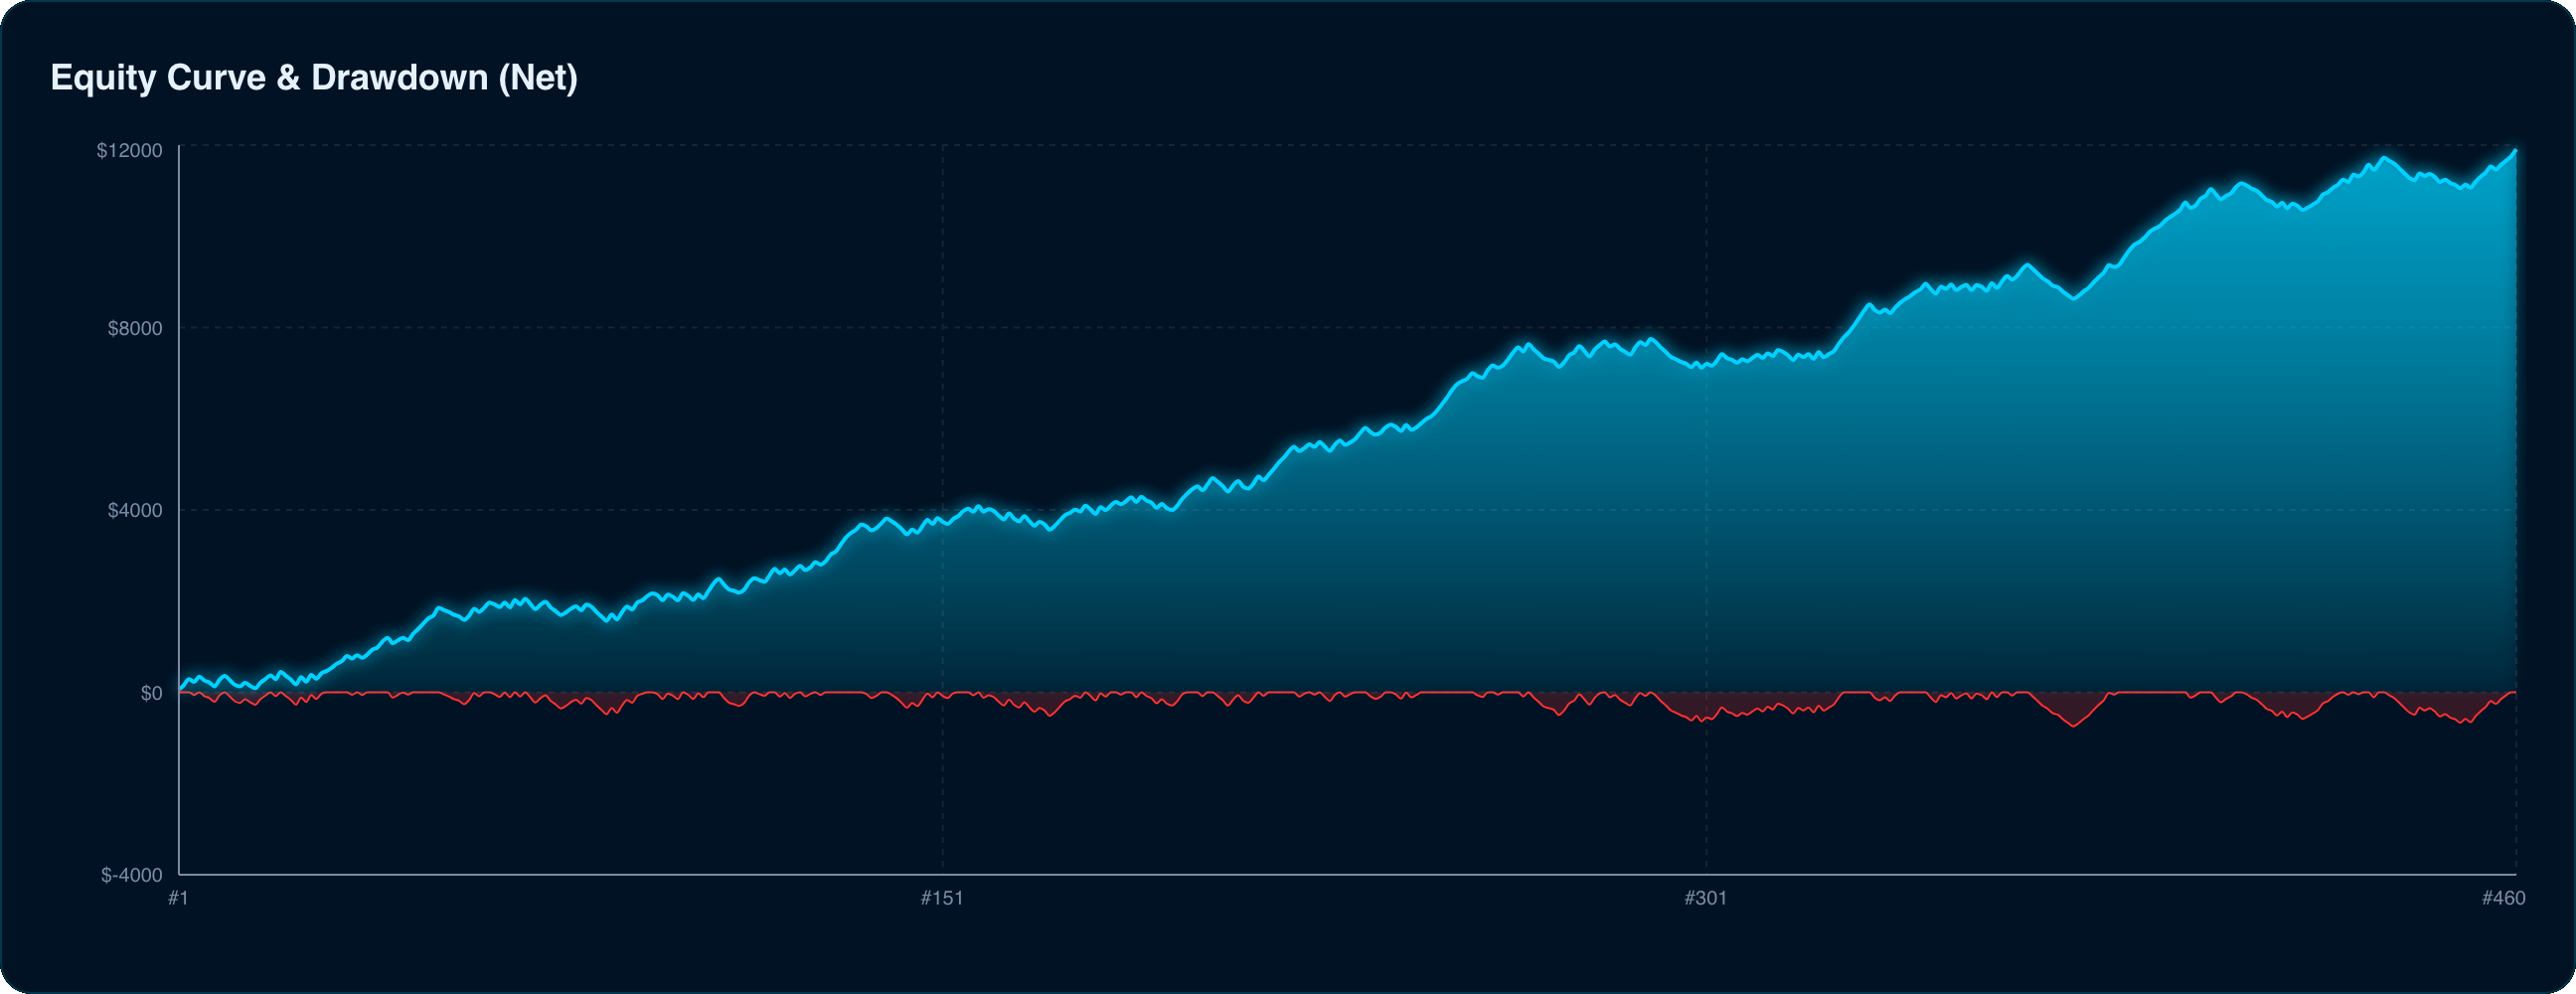
Overview: your equity curve and your drawdown
Your capital trade after trade, with drawdown plotted underneath. You spot your winning streaks, your troughs and how long you take to climb back out of them.
- Cumulative net equity
- Drawdown plotted underneath
- Trade by trade over the whole period
Overview: how consistent you are over time
Rolling stability computes your average PnL and your green-session rate over the last 10 sessions. This is the curve that shows whether you are becoming consistent or living off a few big hits.
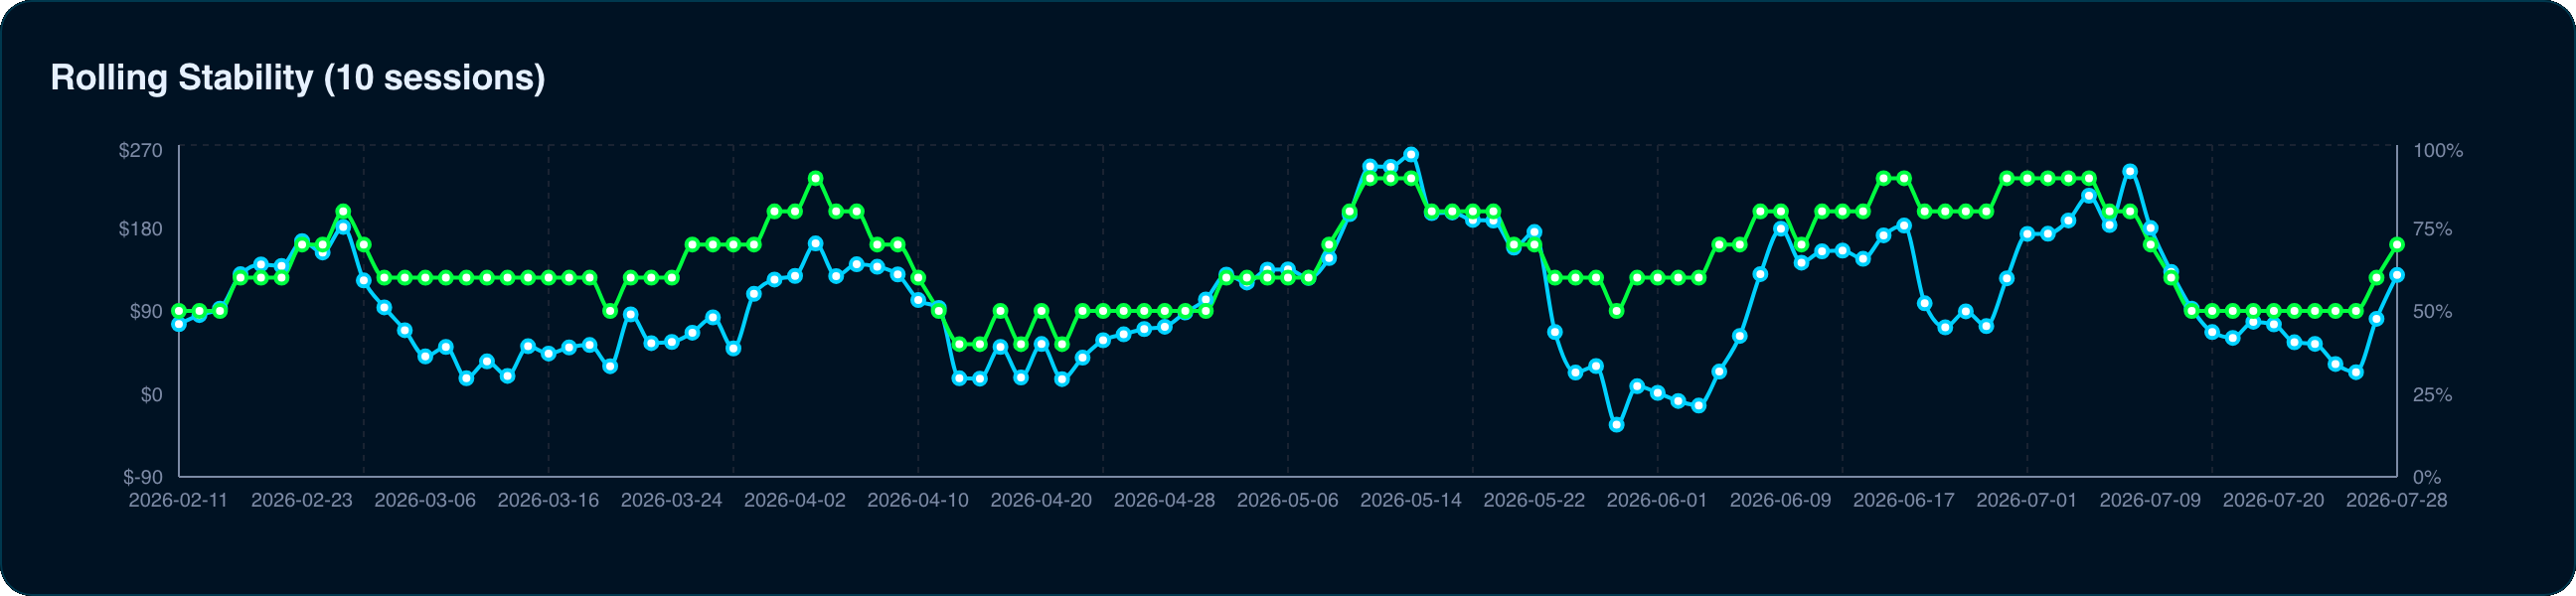
- Rolling average over 10 sessions
- Green-session rate
- Catches the drifting phases
Overview: when and how you win
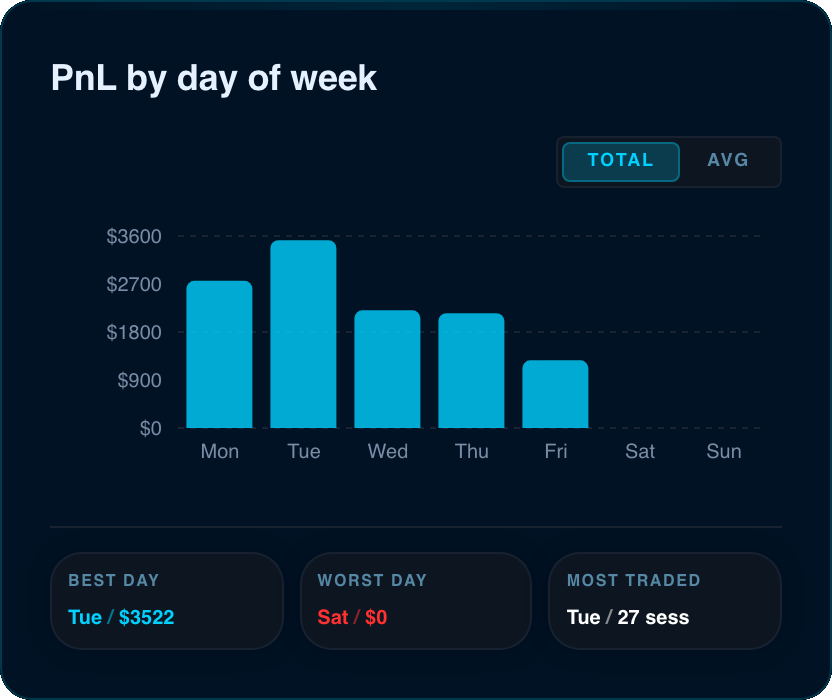
PnL by day of the week, PnL by session, distribution of wins and losses, and how long you hold. You spot your best windows and the habits that cost you.
- PnL by day of the week
- PnL session by session
- Distribution of results
- Average, minimum and maximum duration
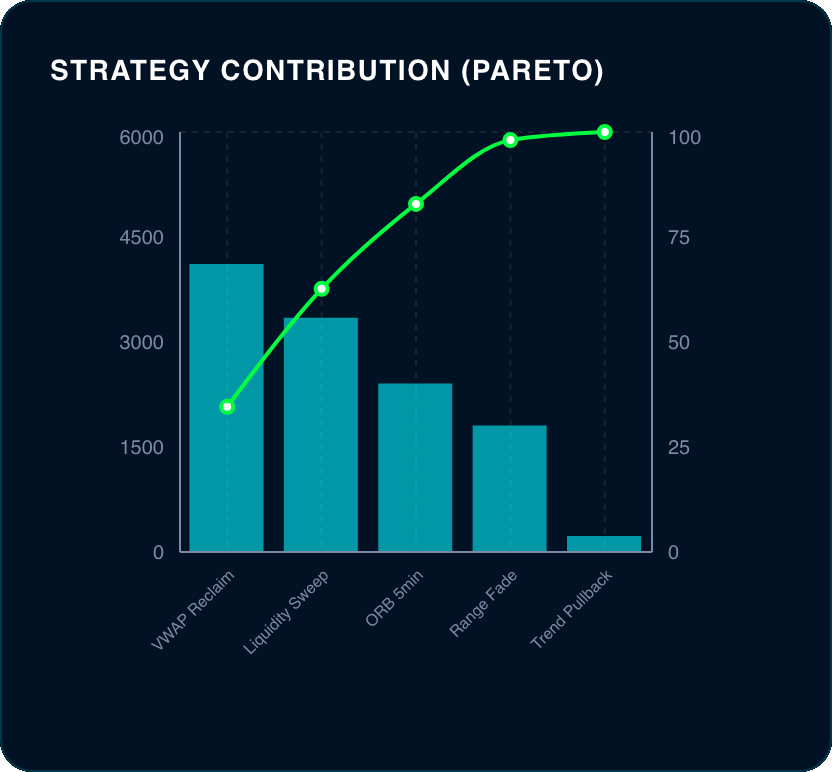
Drivers: where your PnL really comes from
Three contribution analyses: by strategy (with a Pareto curve), by instrument and by market type. You see immediately which blocks are carrying your account.
- Contribution by strategy (Pareto)
- Contribution by instrument
- Contribution by market type
Drivers: the detailed breakdown
A full table, available by strategy, by instrument, by market type and by day of the week. For every row: sessions, trades, net PnL, share of contribution, profit factor, expectancy, win rate, average win and fees per trade.
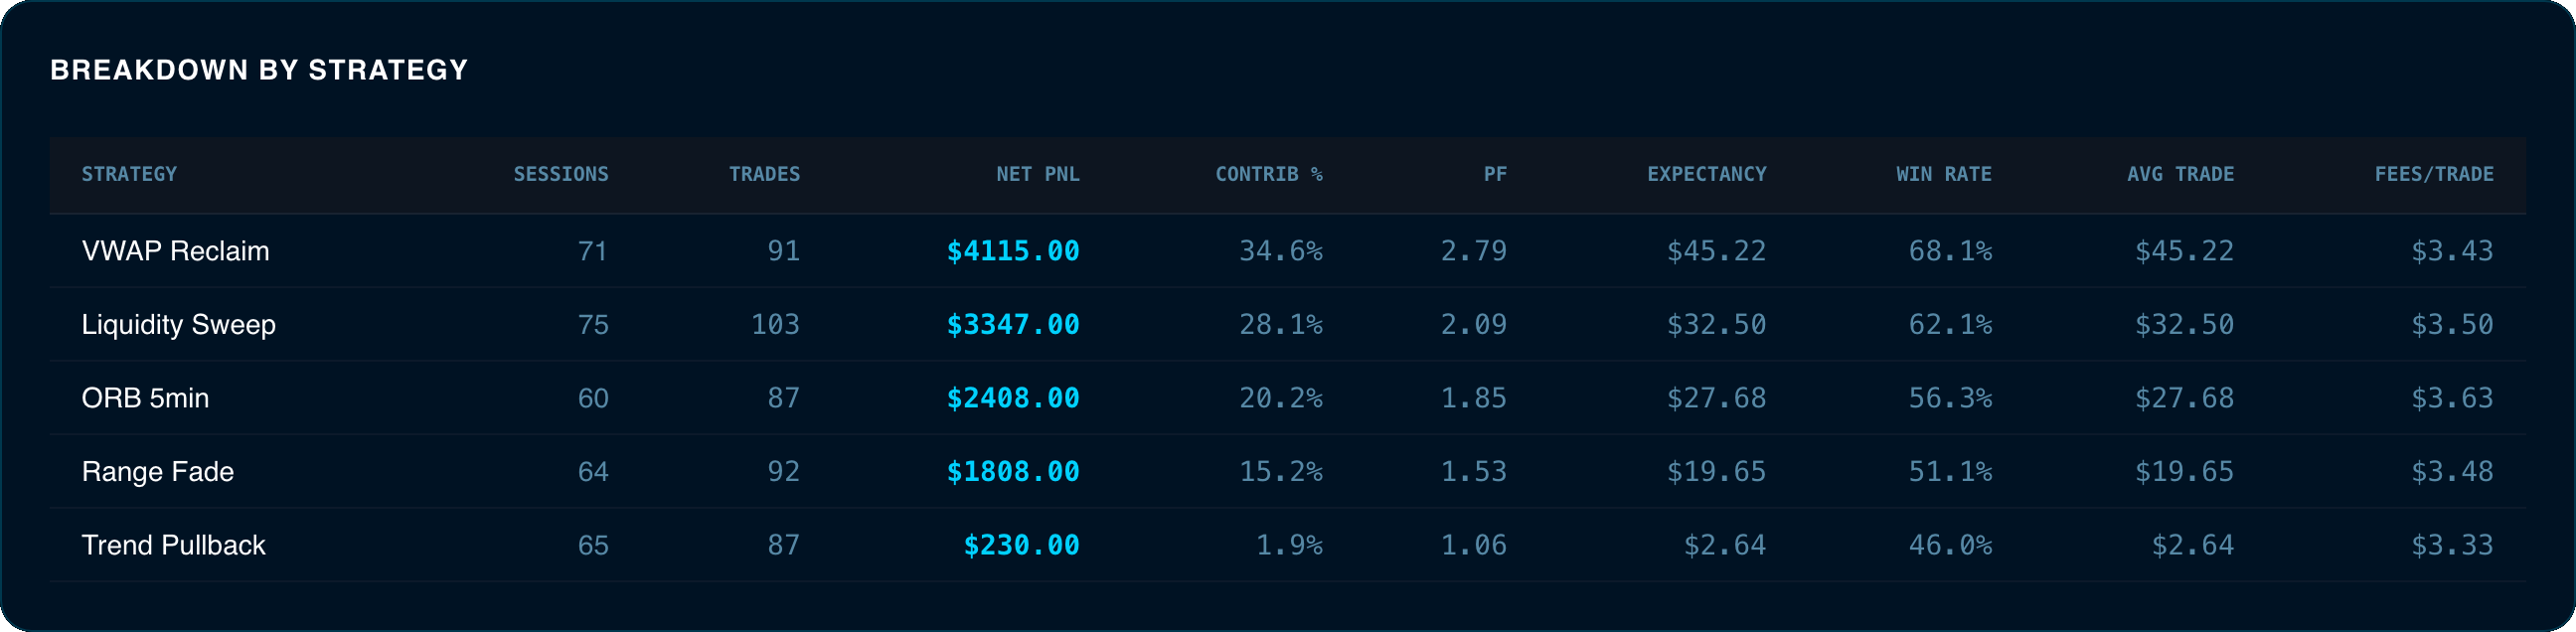
- 4 dimensions: strategy, instrument, market, day
- Sessions, trades, net PnL, contribution
- Profit factor, expectancy, win rate
- Average win and fees per trade
Quality: what indiscipline actually costs
The sharpest contrast in the product: your in-plan trades against your off-plan trades. On one side a solid profit factor, on the other the bleeding, with the cost of each type of deviation.
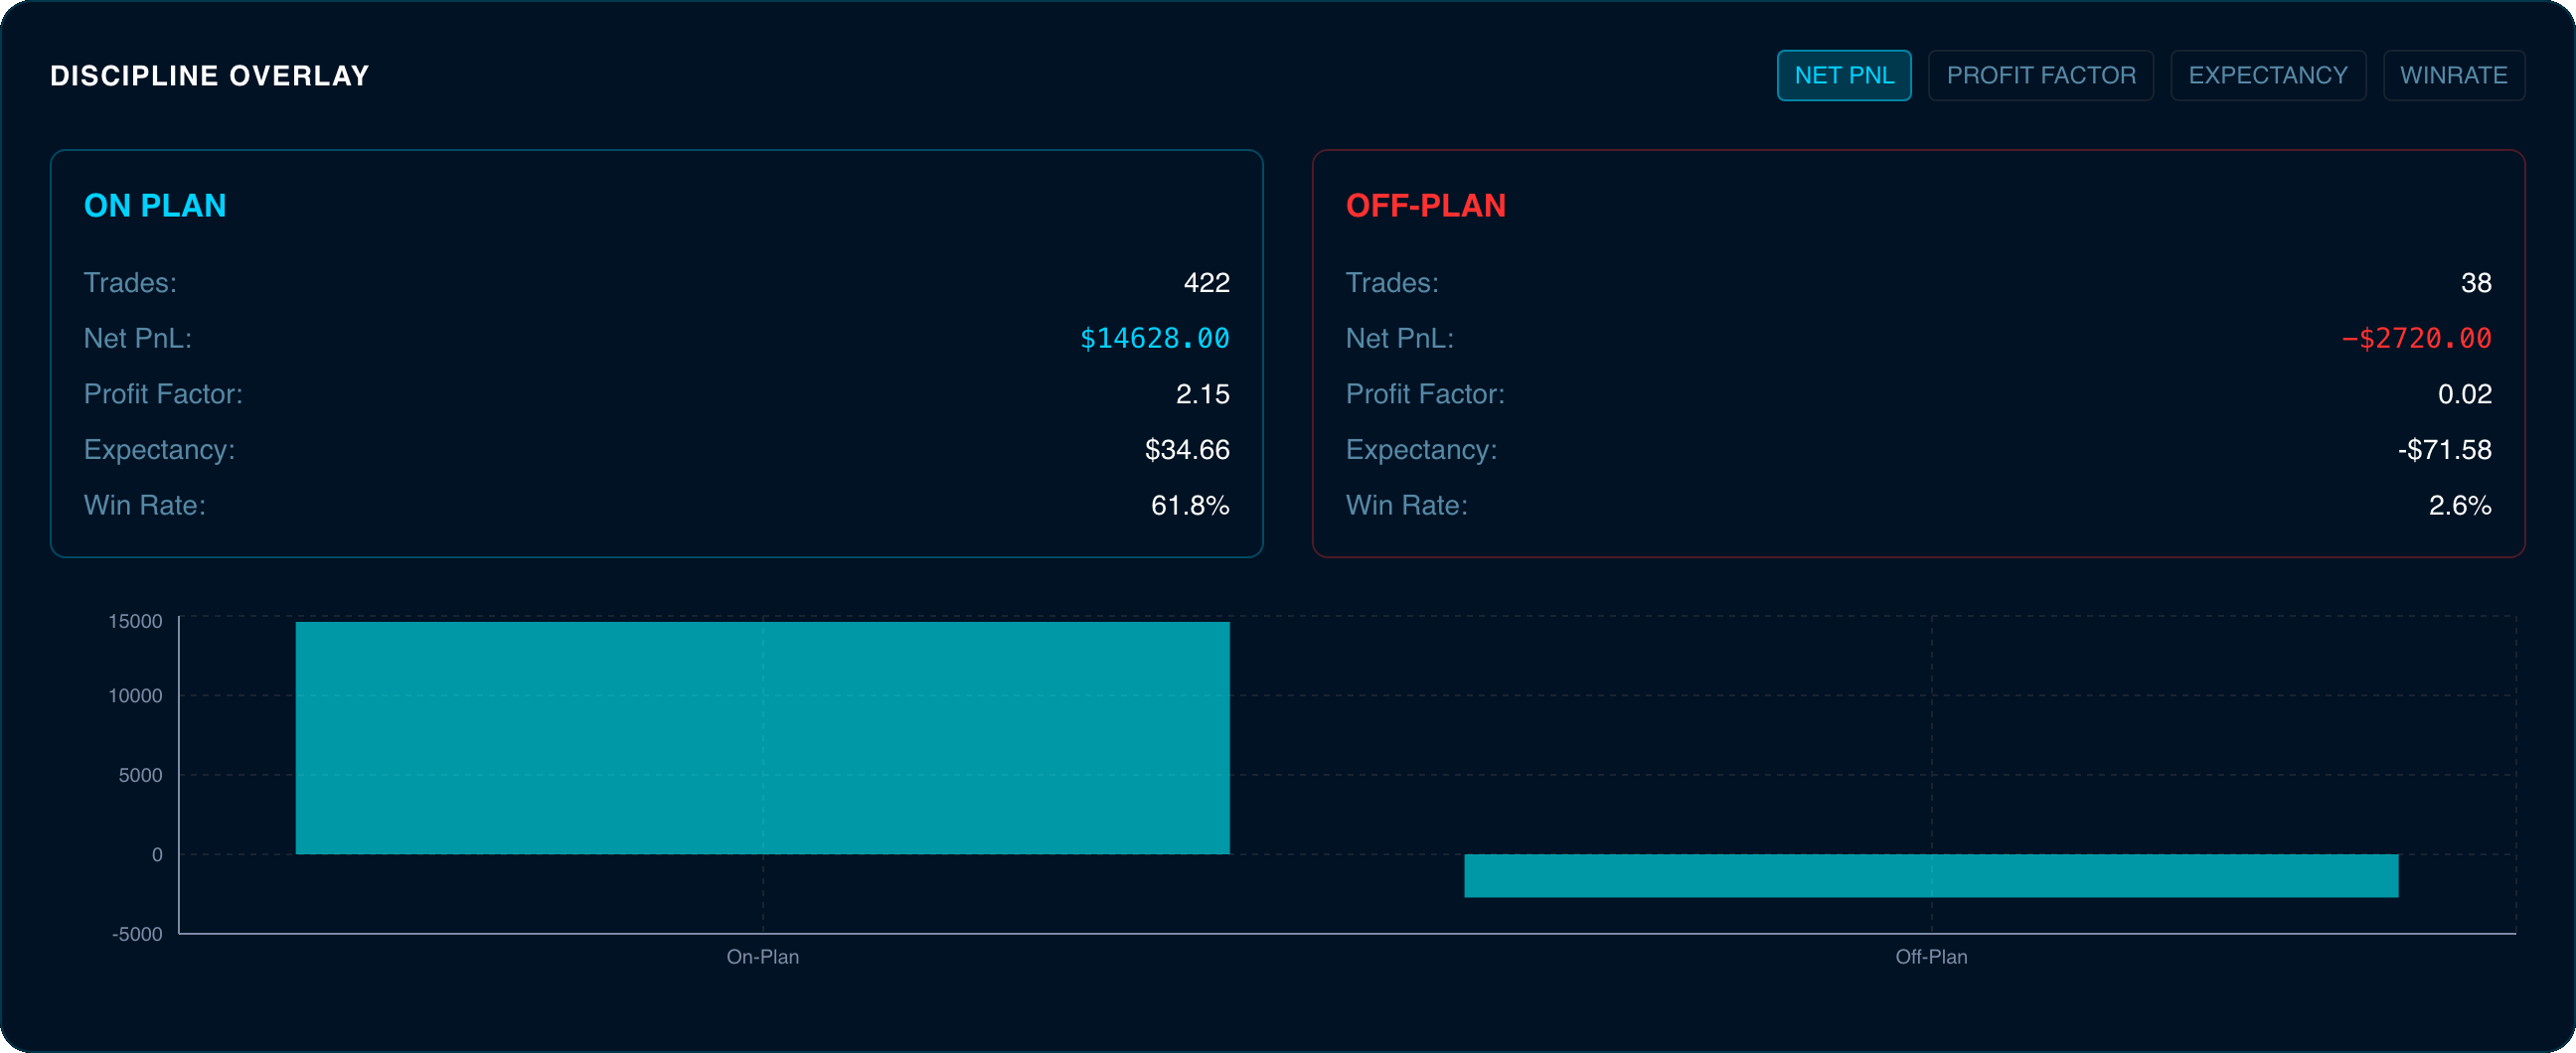
- In plan against off plan: PnL, PF, win rate
- Cost of each loss reason
- Your discipline, in hard numbers


Records: your peaks and your troughs
Best and worst day, longest green and red streaks, recovery time after a trough, and the top 10 of your biggest wins as well as your biggest losses.
- Best and worst day
- Streaks and recovery time
- Top 10 wins and losses
What you get out of it
Explore the other modules
Ready to measure your edge?
Start for free, no credit card.